Prove You’re Watching 100% of your Network
How hard is it for you to prove that you are performing vulnerability scans, network monitoring and log analysis for 100% of your network? If your organization hasn’t automated this process, or it is relying on periodic manual processes, chances are you are blind in some areas and don’t know it.
Tenable recently shipped the ability for our Log Correlation Engine to detect systems, applications and vulnerabilities through log analysis. This lets Tenable Continuous View customers quickly determine the number of systems on their network and which are undergoing vulnerability scanning, network monitoring and log analysis.
Below is an example SecurityCenter dashboard that summarizes the vulnerabilities found from Nessus scans, sniffed vulnerabilities via the Passive Vulnerability Scanner and logged vulnerabilities via Log Correlation Engine.
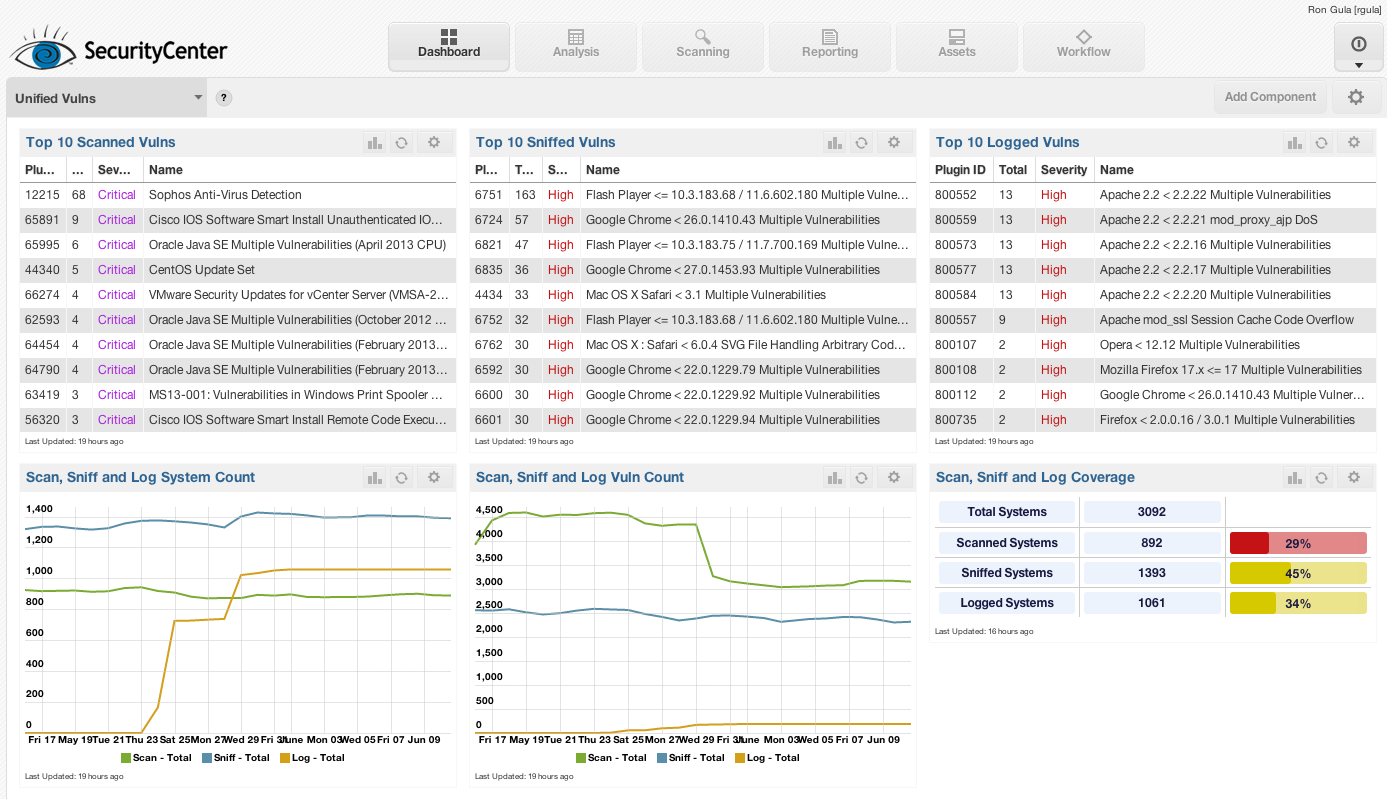
The dashboard also counts and trends the unique number of systems on the network found through log analysis, scanning, and network traffic monitoring. Finally, it charts today’s percentages of system coverage by vulnerability detection types.
I gathered sample screen shots of this dashboard running on a variety of Tenable customer and research sites and found that summarizing the percent coverage for each site told a different story for each location.
The first site considered is a university network that performs vulnerability scanning on only its key servers and passive network monitoring on the rest of the network, including the student and faculty population.
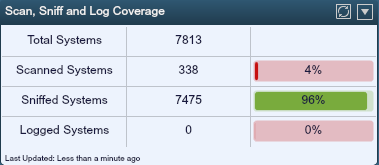
In this case, only a very small percentage of the known network was being scanned. Even worse, these two populations are completely separate with no overlap. The way the dashboard is designed, a system that has logging, scanning and sniffing occurring would still count once to the total systems number. In the above dashboard though, there are absolutely no sniffed systems that are also scanned and vice versa – and none of the system have reported logs via the LCE.
The next sample dashboard comes from a small enterprise network with slightly more than 3000 live systems.
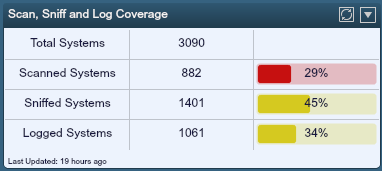
There is a higher percentage of scanning occurring for these hosts than in our previous example, but there is also overlap. Adding the separate counts for logging, scanning and sniffing, there is actually 108% total coverage (29% + 45% + 34+ =108%). There are many systems not being covered at all on this network.
Finally, I’ve included an example for a virtual server farm that had extensive Nessus scanning and logging, but didn’t have very good monitoring with the Passive Vulnerability Scanner.
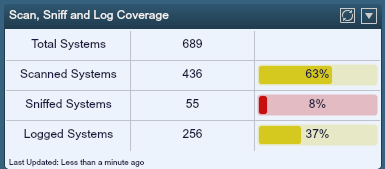
The good news here was that most of the network in question had full process accounting auditing and Nessus credentialed auditing, but the virtualization that was occurring didn’t have a PVS sniffer deployed to watch system to system traffic or boundary traffic.
Of course the goal for these dashboards would be to have 300% coverage, which would mean the same number of sniffed hosts as logged hosts and scanned hosts. Modern networks are complex with many different types of monitoring and this type of goal may not be realistic. However, if you are monitoring your network, you should be able to prove what sort of monitoring you have so that you can compensate for any gaps in coverage you have.
I encourage readers to think about how they would go about creating these types of graphs and charts on their network today. You likely have the data sitting in different systems and spreadsheets. Pulling it together could be enlightening and show you what you are missing. Tenable Continuous View customers can do this in real-time with very little effort, and at a very large network scale.


Tenable One
Request a demo
The world’s leading AI-powered exposure management platform.
Thank You
Thank you for your interest in Tenable One.
A representative will be in touch soon.
Form ID: 7469
Form Name: one-eval
Form Class: c-form form-panel__global-form c-form--mkto js-mkto-no-css js-form-hanging-label c-form--hide-comments
Form Wrapper ID: one-eval-form-wrapper
Confirmation Class: one-eval-confirmform-modal
Simulate Success