Combating malware on the network often seems to be a never-ending battle. New malware is identified daily and virus writers are constantly tweaking their malware to keep it from being detected. Antivirus products and vendors are hard-pressed to keep up. Network defenders need to use a defense-in-depth approach to both protect against malware infections and also discover and address any malware that gets through the defenses. This dashboard can assist an organization in monitoring its malware protection, and identifying malware and related activity on its network.
This dashboard aligns with the NIST Cybersecurity Framework (CSF) subcategories DE.CM-4, DE.CM-5, PR.IP-7, and DE.DP-5 that deal with malware, unauthorized mobile code, and the improvement of network defenses. The CSF provides guidance based on existing standards, guidelines, and practices, which can be tailored to specific organizational needs.
This dashboard provides components to assist an organization in identifying malware already on its network, and viewing events such as virus detections and interactions with known hostile IP addresses that may indicate the presence of malware. The Log Correlation Engine (LCE) is constantly updated with lists of IP addresses and URLs associated with known botnets; as the LCE processes logs, it alerts if one of these hostile IP addresses or URLs is seen. The dashboard also displays the top IP addresses on the network associated with virus detection events, as well as the users most associated with virus events. This enables an analyst to determine on which hosts malware is found and which users may be engaging in activity that exposes the network to viruses; knowing this information can assist in improving network defenses. The dashboard presents indicators for malware-related activity and concerns, and also presents the current antivirus status, including the percentage of hosts on which the installed antivirus is not working properly. Analysts can use this dashboard to easily drill down into the data presented and gain more detailed information.
This dashboard and its components are available in the Tenable.sc Feed, a comprehensive collection of dashboards, reports, Assurance Report Cards, and assets. The dashboard can be easily located in the Tenable.sc Feed under the category Compliance & Configuration Assessment. The dashboard requirements are:
- Tenable.sc 5.2.0
- Nessus 8.5.0
- LCE 6.0.0
- NNM 5.9.0
Many other malware and antivirus-focused dashboards are also available in the Threat Detection & Vulnerability Assessments Feed category. Some suggested dashboards are Malware Detection, Virus Trending, Malicious Process Detection, and Spam Monitoring The Virus Trending and Spam Monitoring dashboards both contain components that break out malware detections by product. The Malware Hunter dashboard can be used to hunt for malware on the network. For CSV (comma-separated value) reports that can be imported and run within Tenable.sc to assist with malware detection, see Malware Detection CSV Reports and More Malware Detection CSV Reports
Tenable.sc Continuous View (Tenable.sc CV) is the market-defining continuous network monitoring solution. Tenable.sc CV includes active vulnerability detection with Nessus and passive vulnerability detection with the Nessus Network Monitor (NNM), as well as log correlation with the Log Correlation Engine (LCE). Using Tenable.sc CV, an organization will obtain the most comprehensive and integrated view of its network and any potential malware activity.
This dashboard contains the following components:
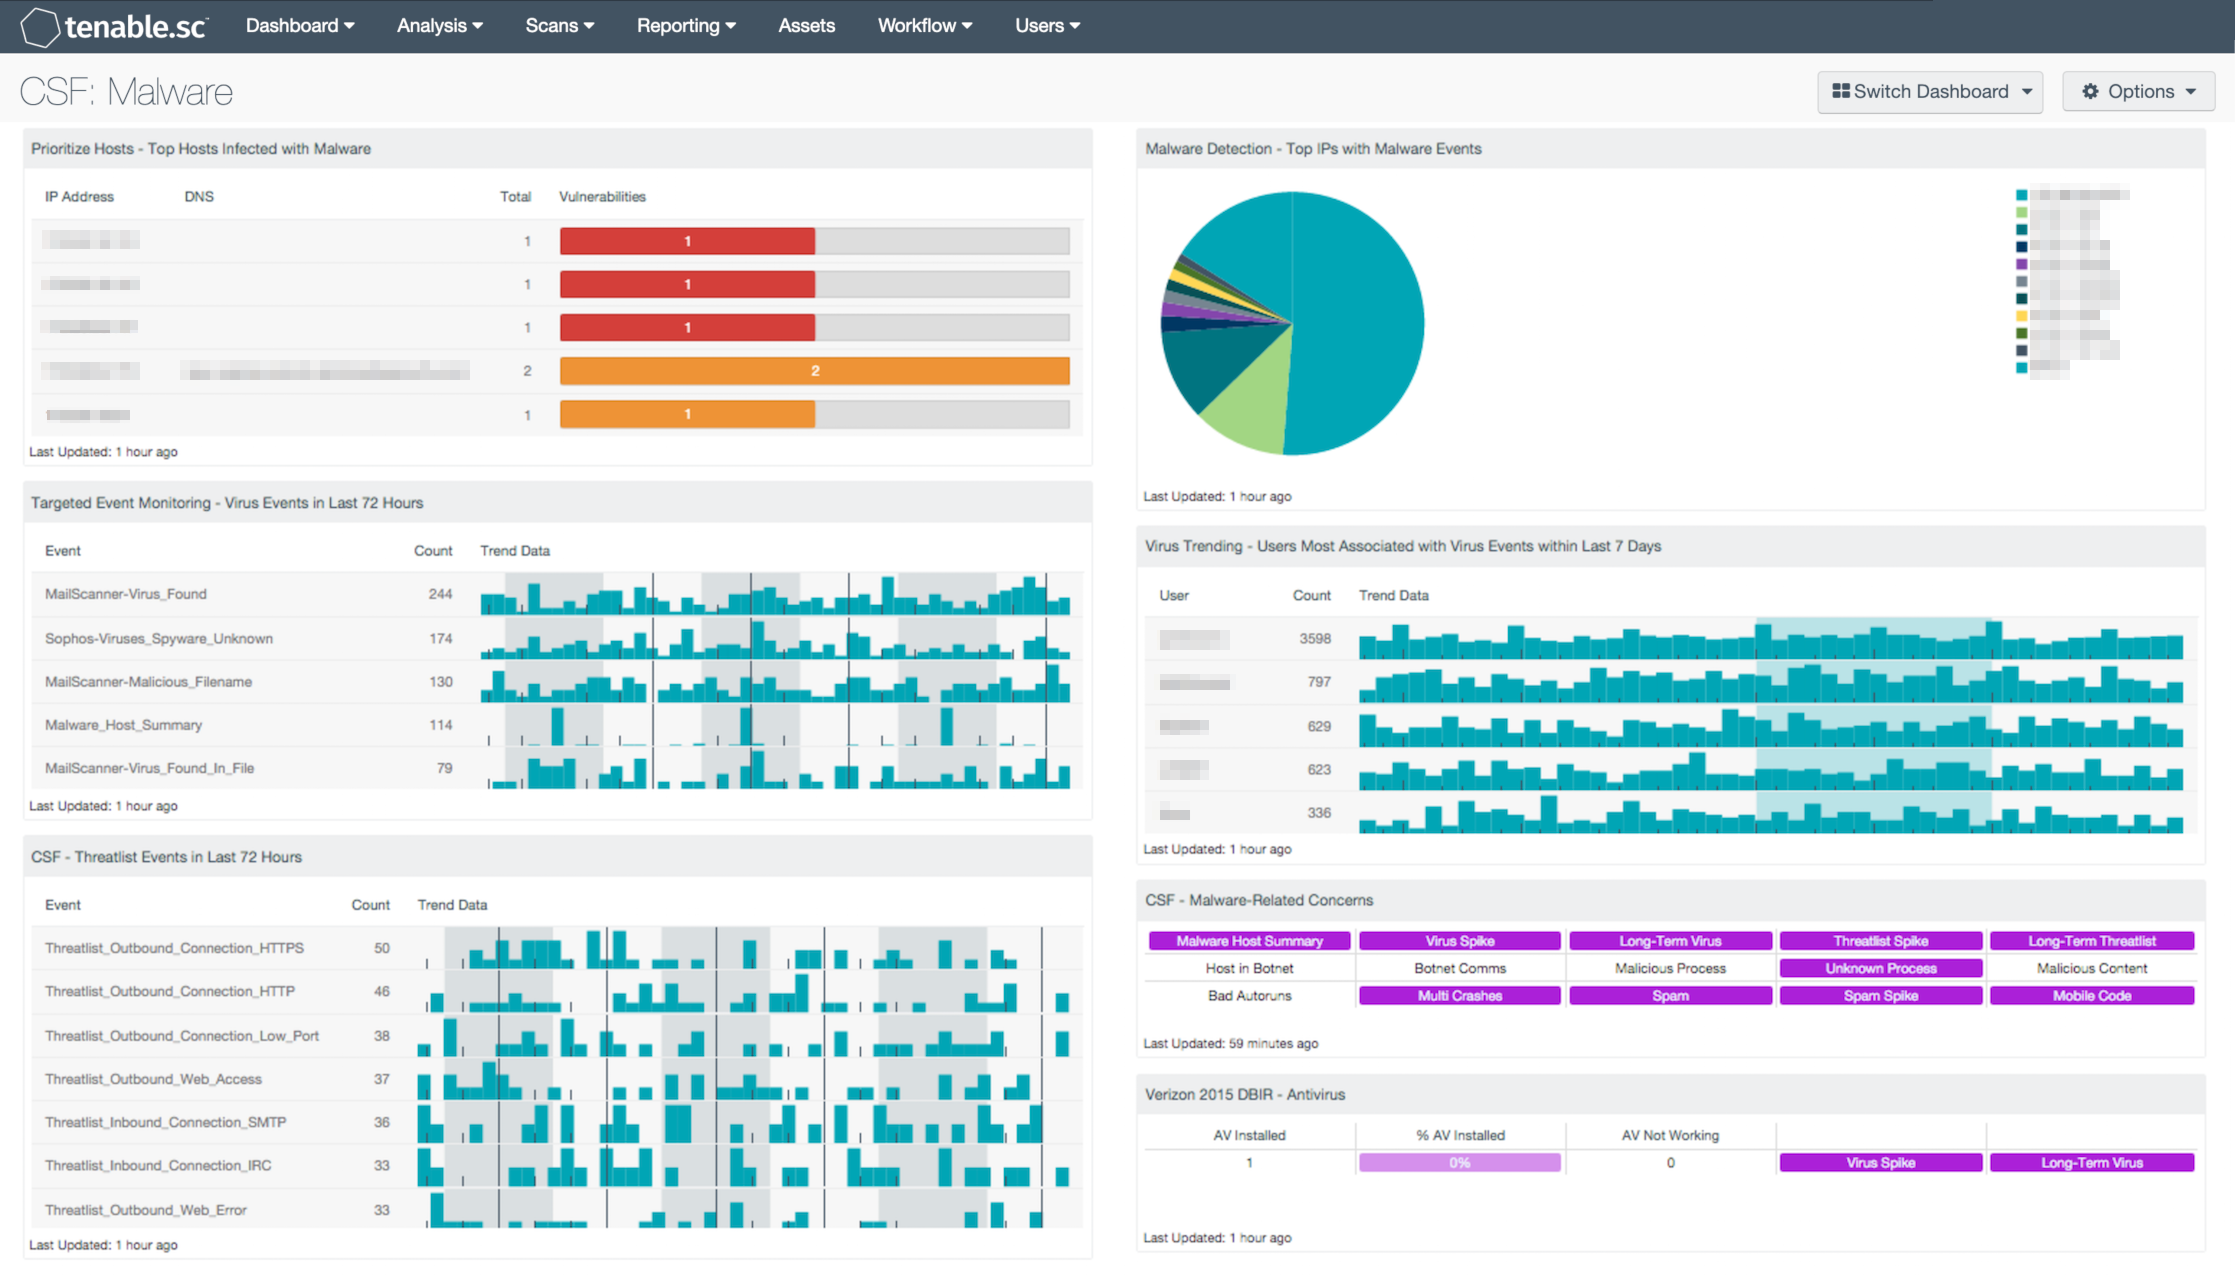
- Prioritize Hosts - Top Hosts Infected with Malware: This table displays the top hosts on the network that have actively or passively detected malware infections. The list is sorted so that the host with the worst malware problem is at the top. A count of malware detections and a bar graph indicating the severity of the malware are given for each host. Use this table to determine the hosts with the biggest malware problems on the network.
- Targeted Event Monitoring - Virus Events in Last 72 Hours: The Virus Events in Last 72 Hours table lists the virus events by count detected in the last three days. Events are normalized by LCE and filtered on the event type “virus,” which can include logs that indicate the presence of a virus in email, a virus found on a system by antivirus software, or virus logs found by network IDS events and firewalls. This component alerts analysts to possible malware infections seen in the past three days to enable quick remediation. Directing focus toward the most recent and prolific infections helps reduce the time between discovery and containment.
- CSF - Threatlist Events in Last 72 Hours: This table displays threatlist events detected in the last three days and sorted by count. Events that are normalized by LCE to the event type “threatlist” include logs that indicate systems communicating with hostile IP addresses and domains that are participating in known botnets. These events may indicate hosts on the network that are infected with malware, and analysts can make use of this information to discover the infected hosts. Clicking on the Browse Component Data icon on the component will bring up the event analysis screen to display details on the events and allow further investigation. In the analysis screen, setting the tool to IP Summary will display the systems on which the events happened. Setting the tool to Raw Syslog will display the raw syslog of the events, which can give more details.
- Malware Detection - Top IPs with Malware Events: This component displays a pie chart of the IP addresses with the most events of type 'virus' that have occurred in the last 7 days. These events were reported by various applications and collected by the LCE. Note that the event counts may not be accurate in some cases because events with the same source and destination IP address will be counted twice for that IP address.
- Virus Trending - Users Most Associated with Virus Events within Last 7 Days: Displayed is trend data for those users most associated with virus activity within the last 7 days, along with their associated event counts. The top 15 users with the highest event counts are displayed. This component provides insight into which users may be engaging in activity that exposes the network to viruses.
- CSF - Malware-Related Concerns: This matrix displays warning indicators for potential malware-related events and vulnerabilities detected on the network, such as virus and threatlist event spikes, botnet interactions, malicious processes and web content, bad Windows autoruns, multiple system crashes, and detections of spam and mobile code. Clicking on a highlighted indicator will bring up the analysis screen to display more details and allow further investigation. In the analysis screen, setting the tool to IP Summary will display the systems on which the detections and events occurred. For vulnerability detections, setting the tool to Vulnerability Details will display the full details for each vulnerability, including a description, the solution to fix the vulnerability, and in some cases, links to more information. For events, setting the tool to Raw Syslog will display the raw syslog of the events, which can give more details. The LCE maintains 24-hour summaries of malware or virus events detected on hosts; these summaries can be viewed by clicking on the Malware Host Summary indicator.
- Verizon 2015 DBIR - Antivirus: The Verizon DBIR advocates deploying an antivirus solution. This matrix assists the organization in monitoring its antivirus deployment. The AV Installed column displays the number of scanned hosts that have AV installed and working properly; the % AV Installed column displays a bar graph of the ratio of systems with AV installed to total systems scanned. The AV Not Working column displays the number of scanned hosts that have AV installed, but it is not working properly or not up to date. The Virus Spike indicator is highlighted purple if a large spike in virus activity was detected in the last 72 hours. The Long-Term Virus indicator is highlighted purple if in the last 72 hours an IP address has been the source of virus or malware events continuously for more than 20 minutes. Clicking on a highlighted indicator will bring up the analysis screen to display details on the detections and events and allow further investigation.
Tenable One
Request a demo
The world’s leading AI-powered exposure management platform.
Thank You
Thank you for your interest in Tenable One.
A representative will be in touch soon.
Form ID: 7469
Form Name: one-eval
Form Class: c-form form-panel__global-form c-form--mkto js-mkto-no-css js-form-hanging-label c-form--hide-comments
Form Wrapper ID: one-eval-form-wrapper
Confirmation Class: one-eval-confirmform-modal
Simulate Success