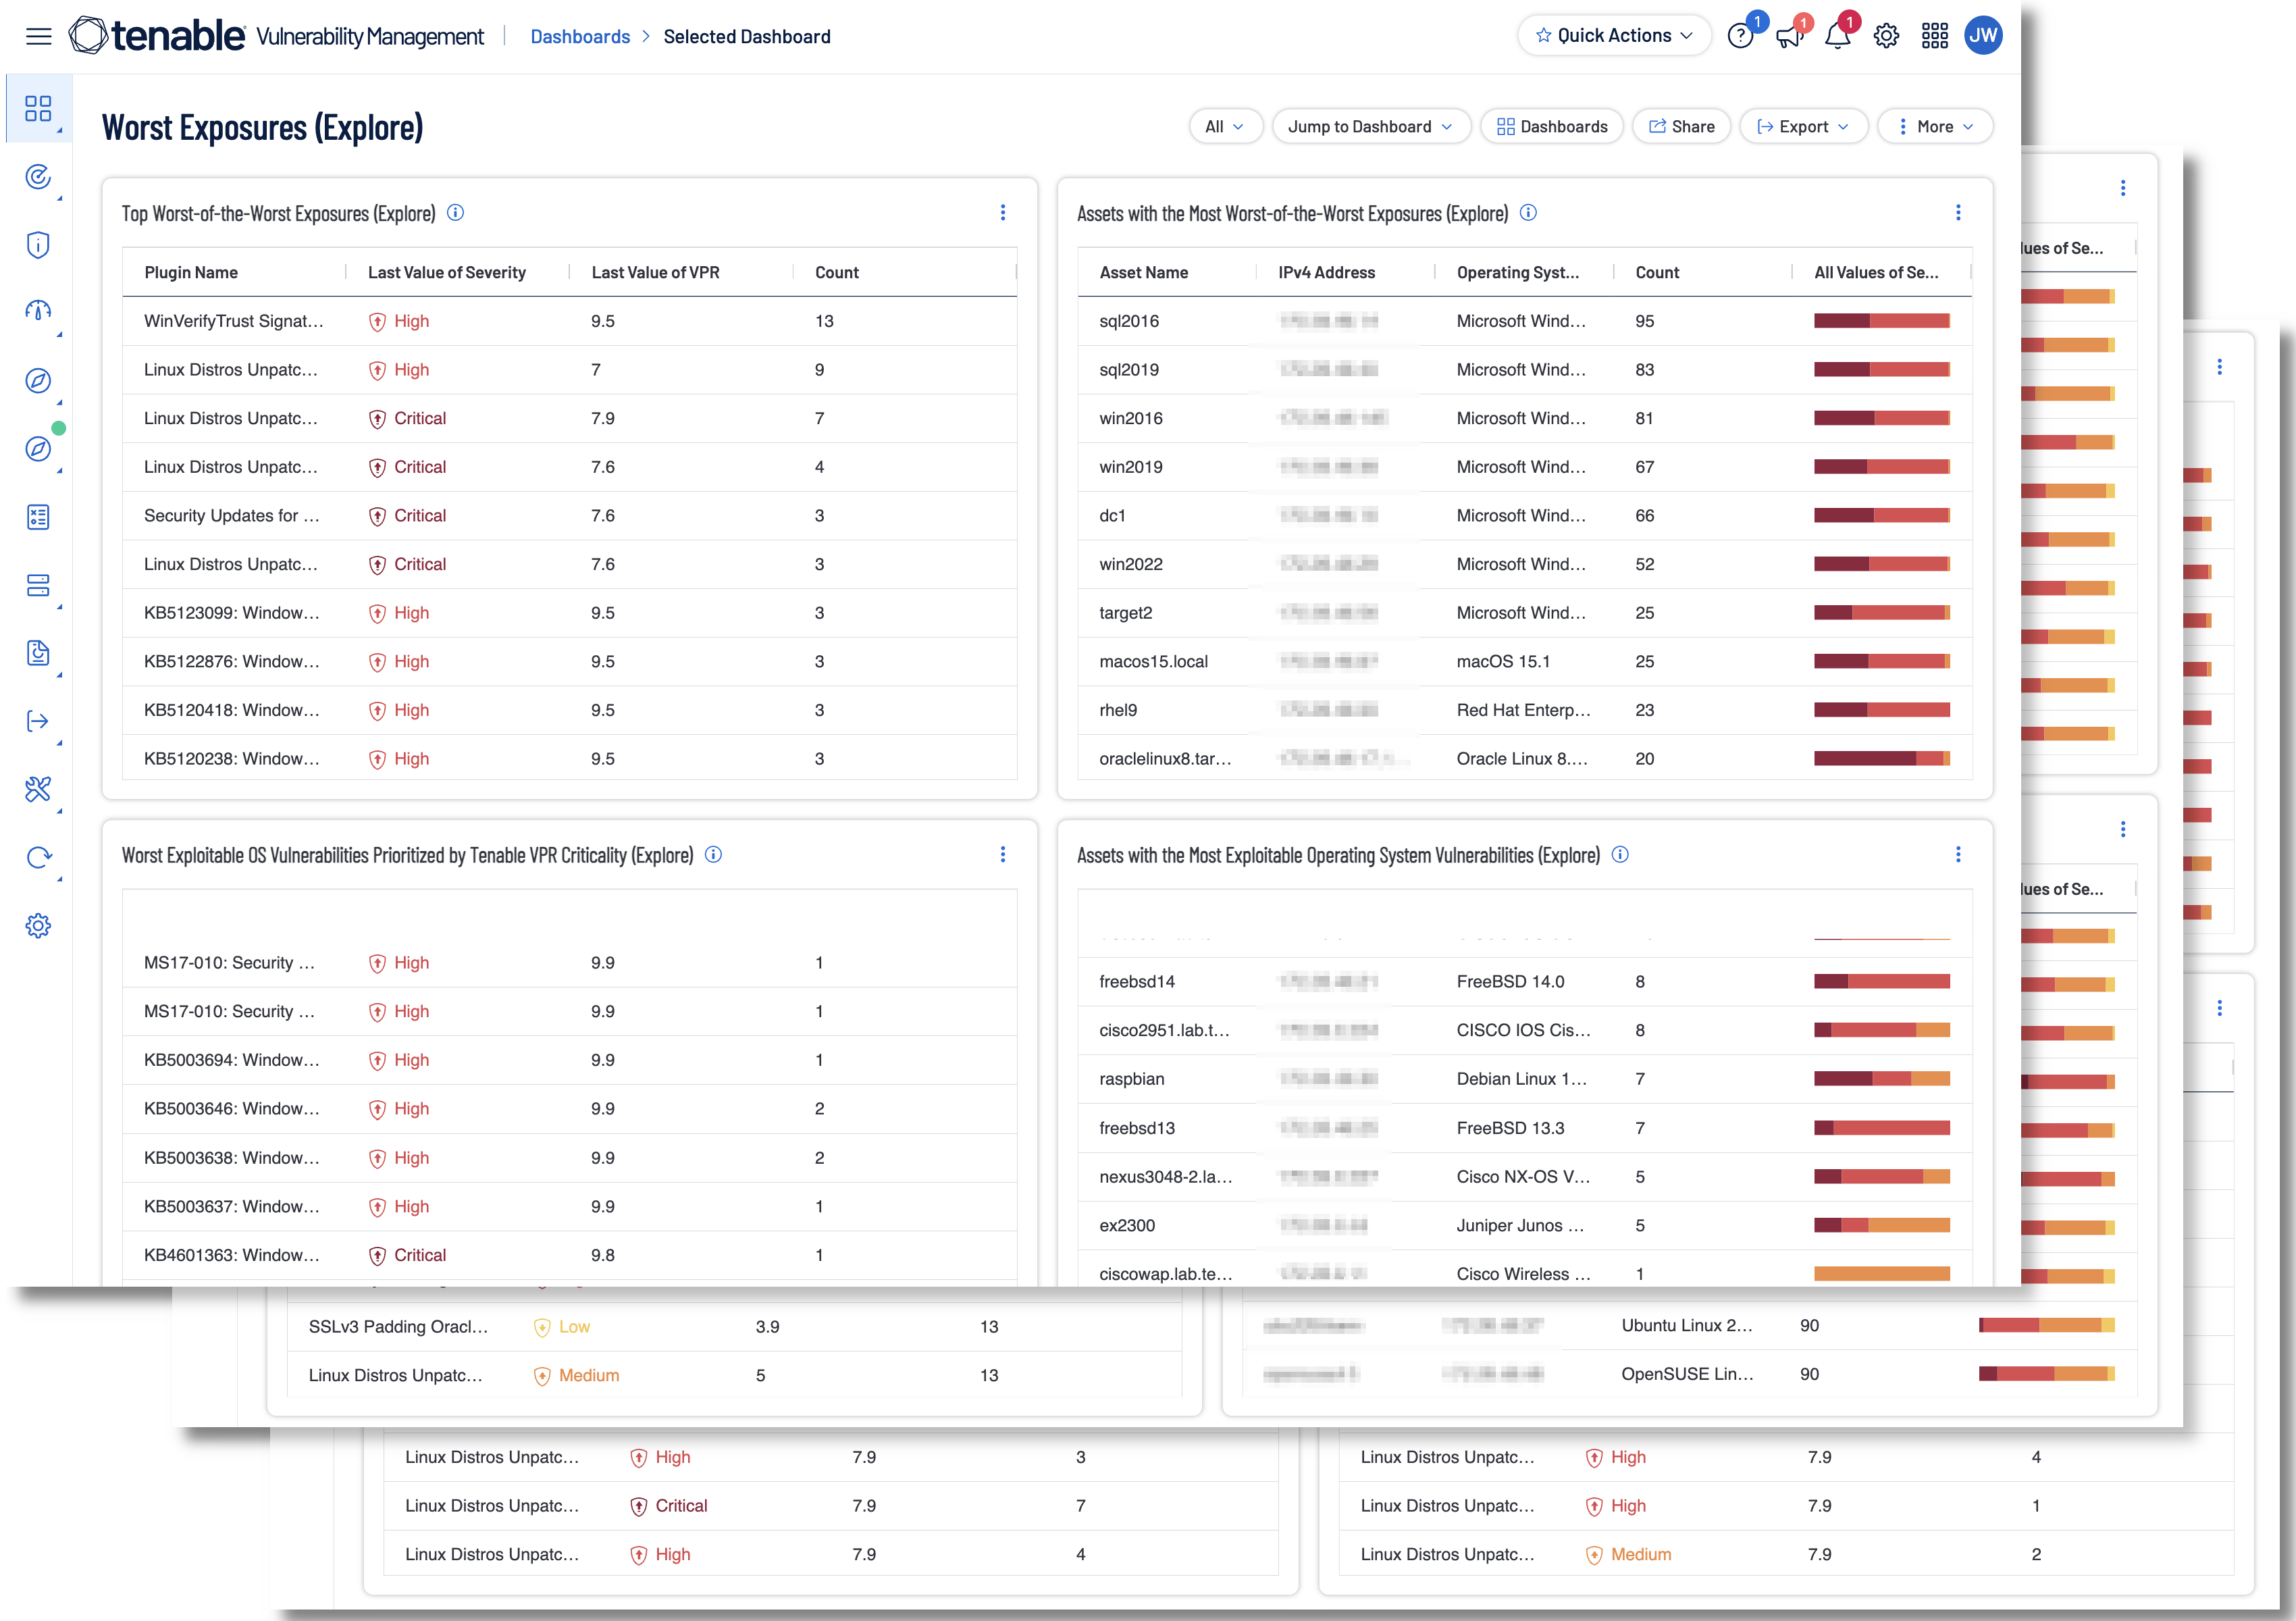
Organizations face a persistent challenge in managing exploitable vulnerabilities across expanding attack surfaces, where the volume of security findings creates decision paralysis and masks the exposures most likely to result in a successful compromise. Security teams struggle to distinguish between theoretical weaknesses and weaponized threats actively exploited by adversaries, leading to remediation strategies that drain resources without measurably reducing business risk. This misalignment between effort and impact stems from limited visibility into which assets harbor the most severe exposures and which vulnerabilities cybercriminals prioritize when selecting targets. The Exploitable Exposures Explore dashboard solves this by unifying asset-centric and vulnerability-centric views prioritized through Tenable VPR scoring, enabling organizations to see everything across their modern attack surface, predict what matters based on real-world exploitation patterns, and act with confidence by directing remediation toward the most critical threats.
Security Managers require a defensible, actionable remediation strategy that translates technical vulnerability data into business-relevant risk assessments executives can understand and support with appropriate resources. Without unified insight into asset concentration patterns and exposure severity rankings, Security Managers face difficulty justifying prioritization decisions to leadership or explaining why certain remediation efforts deserve budget while others can wait. The dashboard addresses this gap by surfacing asset tables ranked by exploitable exposure counts, malware exploitation pathways, and worst-of-worst vulnerability concentrations, allowing Security Managers to identify which systems represent the greatest attack surface and articulate business impact in terms of likelihood and exploitability. These visualizations enable Security Managers to break down silos between vulnerability assessment and risk translation, forge alignment between technical findings and organizational priorities, and communicate a clear roadmap for reducing exposure that resonates with both technical teams and executive stakeholders.
Security Engineers face operational complexity when determining which vulnerabilities warrant immediate remediation and which unpatchable exposures require configuration hardening instead of traditional patching workflows. High volumes of findings across diverse systems create inefficiencies as Security Engineers manually correlate exploit availability, VPR scoring, and asset criticality to build remediation queues that address real risk rather than simply closing tickets. The dashboard streamlines this operational burden by organizing vulnerability data into exploitability-focused categories, separating patchable exposures from configuration-dependent risks, and prioritizing findings through Tenable VPR to highlight threats actively weaponized by cybercriminals. Security Engineers use these focused views to ensure scan coverage completeness, validate that critical assets receive proper assessment depth, and coordinate remediation efforts with IT teams by providing clear, prioritized work lists sorted by actual exploitation likelihood. This operational efficiency allows Security Engineers to move from reactive firefighting to proactive risk reduction, confident that the data driving remediation decisions reflects the true state of organizational exposure.
The dashboard reveals organizational security posture through three thematic lenses: asset concentration analysis showing which systems accumulate the highest exploitable vulnerability counts, vulnerability prevalence rankings identifying the most widespread threats across the environment, and malware exploitation pathway mapping highlighting exposures cybercriminals actively weaponize for compromise. Asset-focused views expose where risk concentrates geographically or functionally, allowing teams to recognize patterns such as legacy infrastructure hosting unsupported products or specific application portfolios harboring disproportionate OS-level weaknesses. Vulnerability-centric rankings surface the specific CVEs and exposure types appearing most frequently, enabling teams to pursue broad-spectrum remediation campaigns that eliminate entire vulnerability classes rather than addressing individual instances. The inclusion of unpatchable vulnerability categories distinguishes exposures requiring configuration changes from those resolved through traditional patching, preventing Security Engineers from wasting effort pursuing patch deployments for issues that demand architectural remediation instead.
By unifying visibility into exploitable exposures across the attack surface, the dashboard enables organizations to move from reactive vulnerability management to proactive exposure reduction aligned with business priorities. Security Engineers leverage detailed vulnerability intelligence to validate scan coverage and build remediation queues ranked by actual exploitation likelihood, while Security Managers translate these technical findings into strategic risk narratives that justify resource allocation and demonstrate measurable progress to executive leadership. This collaborative workflow embodies the principles of unified vision, unified insight, and unified action by bringing asset-level and vulnerability-level perspectives together as one coherent risk picture. The organization gains confidence that remediation efforts target the vulnerabilities cybercriminals prioritize when selecting targets, that unpatchable exposures receive appropriate configuration hardening rather than futile patch attempts, and that security investment delivers maximum risk reduction per dollar spent.
Widget
• Top Worst-of-the-Worst Exposures (Explore) - This widget lists the most dangerous vulnerabilities meeting all critical-risk criteria simultaneously (remotely exploitable, no authentication required, VPR of 7 or higher, and a confirmed exploit available), sorted by affected host count to surface the most widespread emergency remediation targets.
• Assets with the Most Worst-of-the-Worst Exposures (Explore) - This widget ranks the top 200 assets by concentration of worst-of-the-worst vulnerabilities, identifying the hosts that represent the highest-value targets from an attacker's perspective and are candidates for immediate isolation or emergency patching.
• Worst Exploitable OS Vulnerabilities Prioritized by Tenable VPR Criticality (Explore) - This widget surfaces the top 200 exploitable OS vulnerabilities ranked by Tenable VPR score, ensuring the threats most likely to be exploited in the wild rise above lower-risk findings for targeted patch prioritization.
• Assets with the Most Exploitable Operating System Vulnerabilities (Explore) - This widget identifies the top 200 assets with the highest concentration of exploitable OS vulnerabilities, helping Security Engineers prioritize OS patch deployment cycles where patching debt is accumulating most.
• Worst Exploitable Application Vulnerabilities Prioritized by Tenable VPR Criticality (Explore) - This widget surfaces the top 200 exploitable application vulnerabilities ranked by Tenable VPR score, separating application threats with confirmed real-world exploitation from those with high CVSS but no active threat intelligence.
• Assets with the Most Exploitable Application Vulnerabilities (Explore) - This widget identifies the top 200 assets with the highest concentration of exploitable application-layer vulnerabilities, scoped to CPE type 'a' to isolate application risk from OS-level exposure for targeted remediation coordination.
• Assets with the Most Exploitable Exposures (Explore) - This widget ranks the top 200 assets by total exploitable vulnerability count across all classes, providing a broad triage view of which hosts carry the widest overall attack surface regardless of vulnerability category.
• Most Prevalent Exploitable Exposures (Explore) - This widget ranks the top 200 exploitable vulnerabilities by affected asset count, revealing which exposures have the broadest reach so Security Engineers can maximize risk reduction by remediating the most widespread findings first.
• Assets with the Most Malware Exposures (Explore) - This widget ranks the top 200 assets by count of malware-exploitable vulnerabilities, identifying the hosts most susceptible to automated malware campaigns and lateral movement that require urgent hardening or compensating controls.
• Most Prevalent Malware Exposures (Explore) - This widget ranks the top 200 malware-exploitable vulnerabilities by affected host count, surfacing the specific weaknesses enabling the broadest malware propagation paths so remediation eliminates the most entry points per effort.
• Worst Unpatchable Exploitable OS Vulnerabilities (Requires Config Change) (Explore) - This widget identifies the most critical exploitable OS vulnerabilities with no vendor-published patch, sorted by VPR to surface threats that require configuration changes (such as protocol disabling or OS upgrades) rather than standard patch deployment.
• Worst Unpatchable Exploitable Application Vulnerabilities (Requires Config Change) (Explore) - This widget identifies the most critical exploitable application vulnerabilities with no vendor-published patch, sorted by VPR to highlight application risks that require configuration hardening or version upgrades outside normal patch management workflows.
• Top Unsupported Product v2 (Explore) - This widget lists the top 200 most pervasive unsupported and end-of-life products by affected asset count, quantifying which specific end-of-life product lines will accumulate unpatched vulnerabilities indefinitely until upgraded or decommissioned.
• Assets with the Most Unsupported Product v2 (Explore) - This widget identifies the top 200 assets running the highest number of unsupported or end-of-life products, flagging where lifecycle investment is most urgently needed for upgrade planning, decommissioning, or network isolation.
Tenable One
Request a demo
The world’s leading AI-powered exposure management platform.
Thank You
Thank you for your interest in Tenable One.
A representative will be in touch soon.
Form ID: 7469
Form Name: one-eval
Form Class: c-form form-panel__global-form c-form--mkto js-mkto-no-css js-form-hanging-label c-form--hide-comments
Form Wrapper ID: one-eval-form-wrapper
Confirmation Class: one-eval-confirmform-modal
Simulate Success