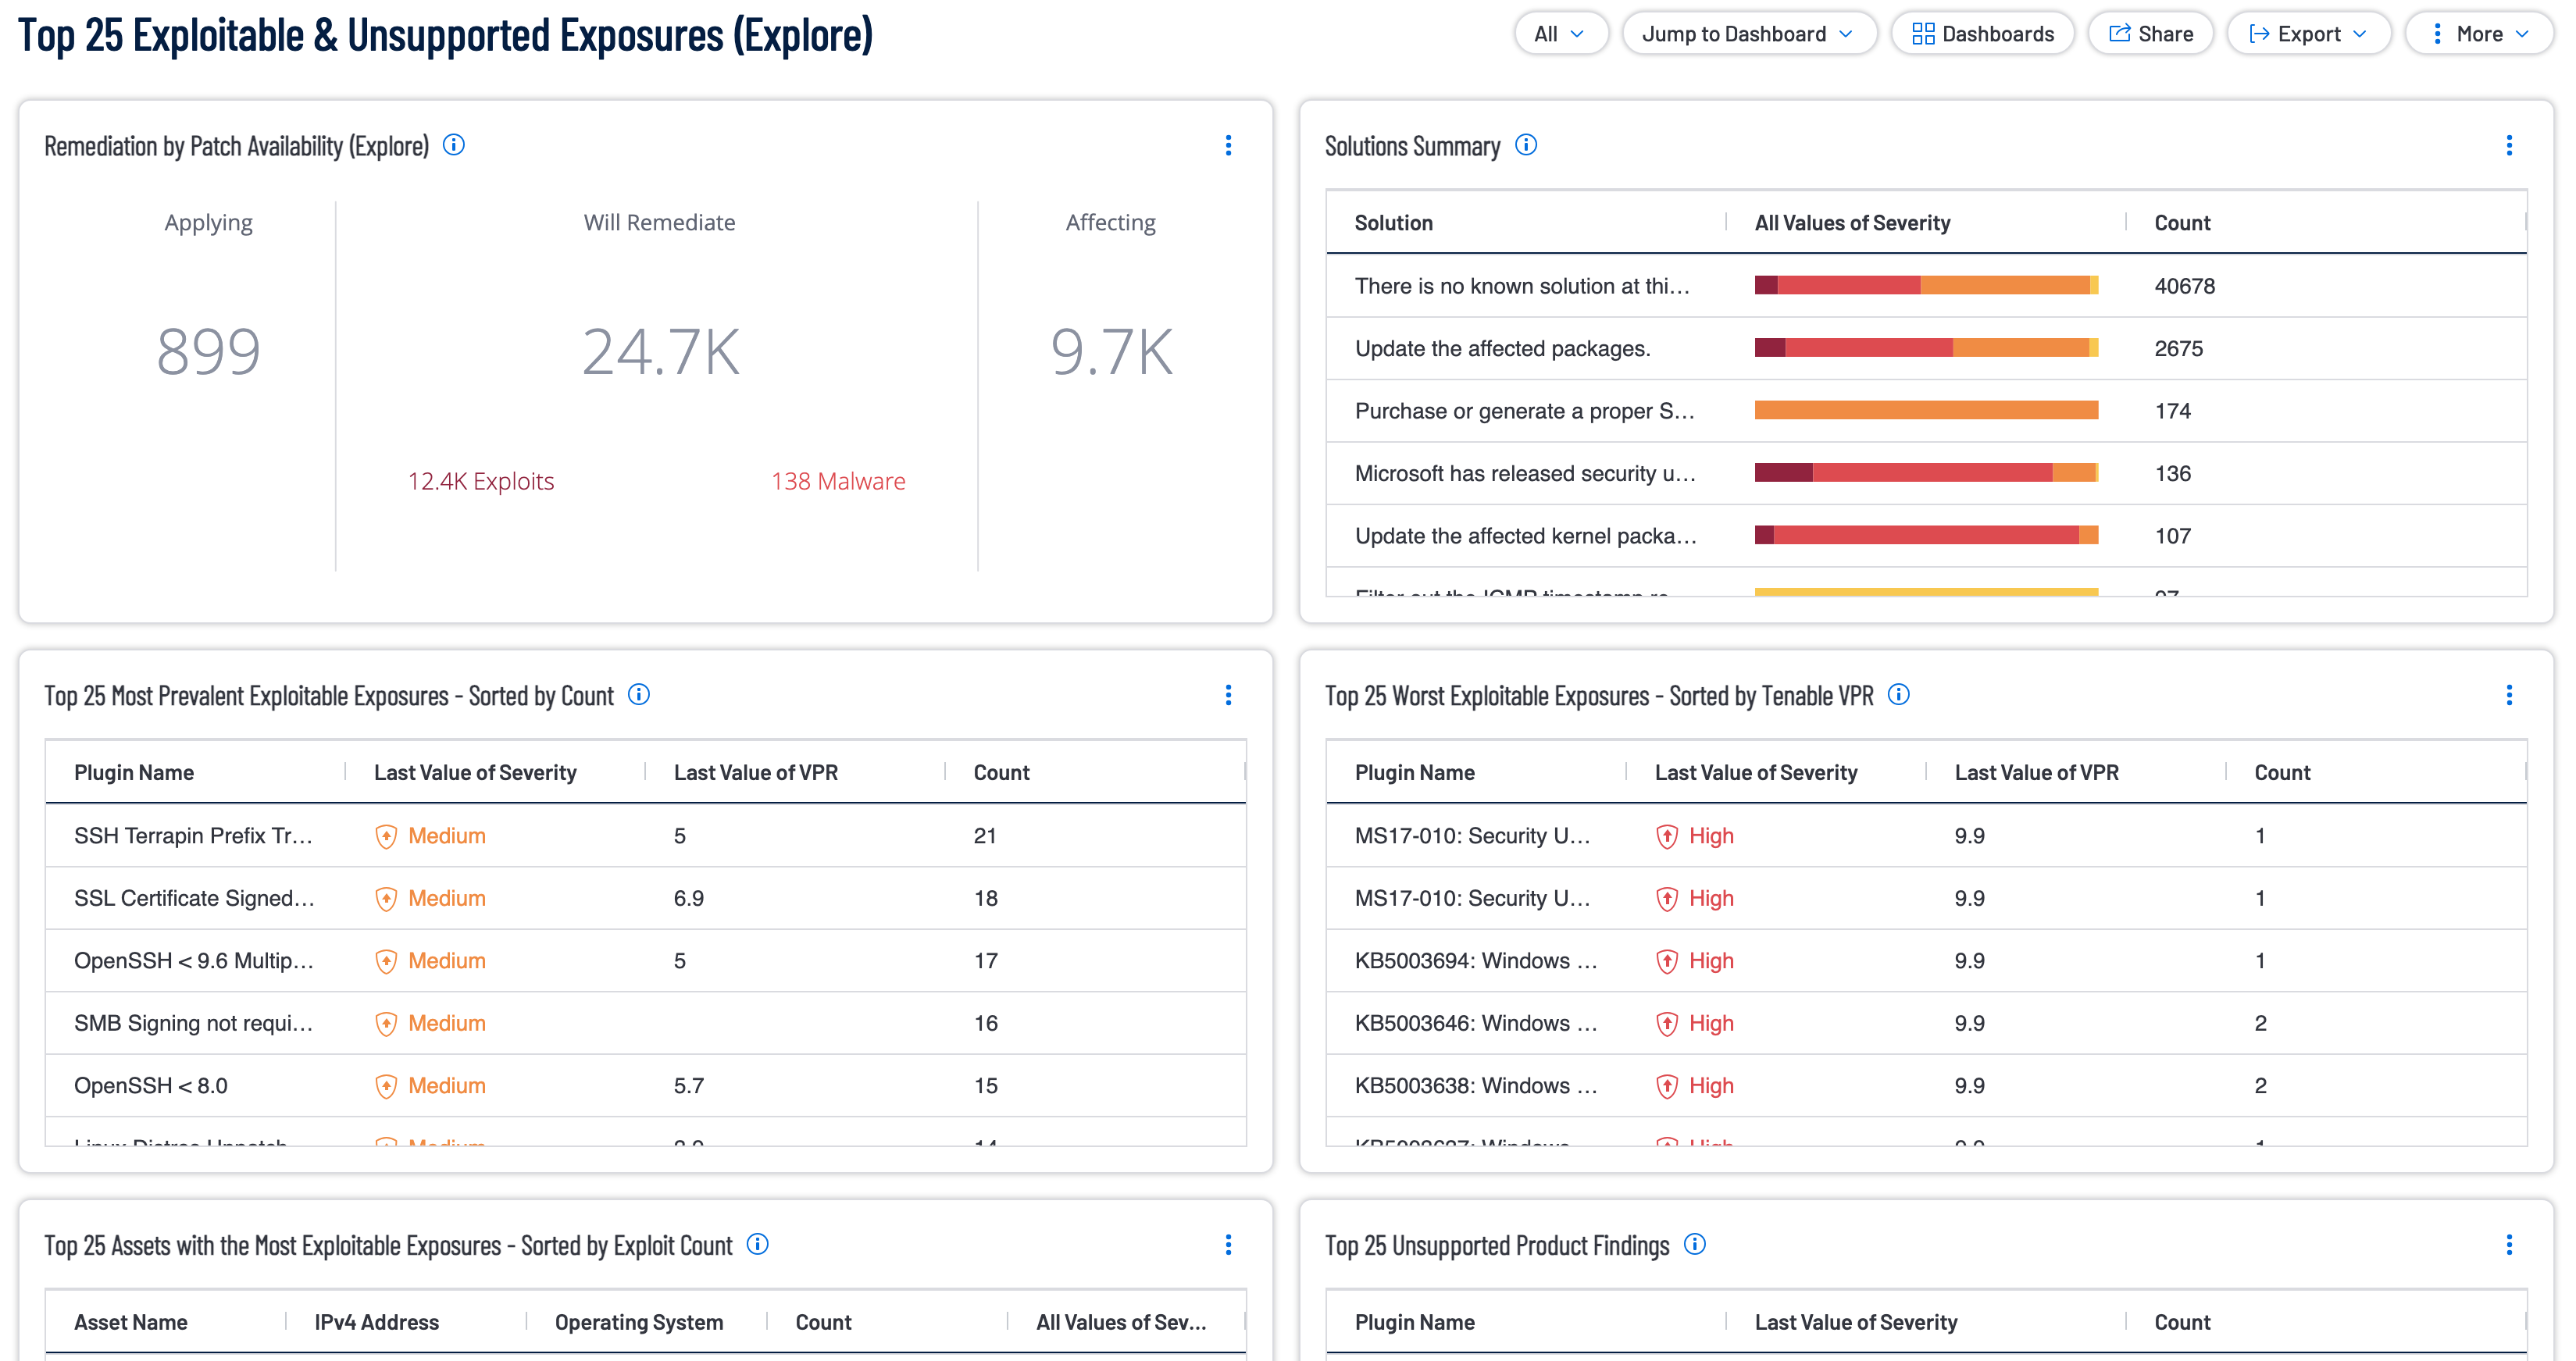
Managing exploitable exposures across a modern enterprise environment requires more than a list of vulnerabilities; organizations need to understand which exposures are actively weaponized, which assets carry the greatest concentration of risk, and which remediations will yield the most meaningful reduction in attack surface. Security Managers face the challenge of translating an overwhelming volume of findings into focused program priorities that can be communicated clearly to executive leadership and acted upon within existing resource constraints. Security Engineers encounter the operational difficulty of distinguishing between patchable vulnerabilities and those requiring architectural changes or product replacement, a distinction that fundamentally changes the remediation strategy and timeline. Unsupported products introduce permanent exposures that fall outside the scope of traditional patching workflows, creating risk categories that require dedicated lifecycle management strategies. The Top 25 Exploitable Exposures dashboard addresses these challenges by providing structured visibility into the most prevalent and most severe exploitable vulnerabilities, the assets most affected, and the specific remediation actions available, enabling the organization to prioritize risk reduction with confidence and precision.
Security Managers responsible for communicating risk and directing remediation programs often lack a structured view that distinguishes exploitable vulnerabilities ranked by breadth across the environment from those ranked by severity and likelihood of exploitation. Without this distinction, program prioritization depends on intuition rather than data, and executive reporting may not accurately reflect where the organization faces the most immediate threat. The dashboard provides Security Managers with ranked views of the most prevalent exploitable exposures sorted by affected asset count alongside the most dangerous vulnerabilities ranked by Tenable's Vulnerability Priority Rating, enabling decisions that balance both breadth and criticality. Asset-level concentration tables allow Security Managers to identify specific systems accumulating disproportionate exploitable risk, supporting targeted remediation escalations and maintenance window justifications. By combining exposure breadth, severity rankings, and asset concentration data, Security Managers gain the contextual clarity needed to allocate remediation resources effectively and provide defensible, data-driven updates to organizational leadership.
Security Engineers managing vulnerability remediation pipelines frequently encounter a technical gap between identifying vulnerabilities and determining the correct remediation approach for each finding. Patchable vulnerabilities, unpatchable exposures requiring configuration changes, and end-of-life products requiring replacement each demand distinct workflows, yet without structured visibility these categories become conflated and remediation planning loses precision. The dashboard equips Security Engineers with dedicated views that separate exploitable vulnerabilities by remediation pathway: those with available patches ranked by prevalence or severity, those requiring configuration hardening where no patch exists, and product findings tied to unsupported software at or past end-of-life. The Remediation by Patch Availability and Solutions Summary widgets provide actionable aggregates that translate individual findings into batched remediation actions, reducing the time Security Engineers spend on triage and allowing effort to concentrate on execution. By providing this structured operational data, the dashboard enables Security Engineers to build credible remediation plans, communicate effort estimates accurately, and demonstrate measurable progress against the organization's exploitable exposure backlog.
The dashboard's widget themes reflect three distinct dimensions of exploitable exposure risk that together form a complete picture of organizational vulnerability posture. The first theme centers on vulnerability-level rankings, where tables identify the most prevalent exploitable findings by affected asset count and the most dangerous by Tenable's Vulnerability Priority Rating, including a dedicated view for vulnerabilities where no patch has been published and remediation requires configuration or architectural change. The second theme addresses asset-level risk concentration, highlighting the specific hosts accumulating the most exploitable vulnerabilities and the most unsupported products, enabling the organization to identify high-risk systems that may require prioritized remediation sprints or immediate compensating controls. The third theme covers remediation intelligence, with widgets surfacing patch availability statistics and grouped solution recommendations that connect individual vulnerabilities to concrete remediation actions. Together, these themes enable the organization to view exploitable exposure not merely as a count of findings but as a structured risk landscape with clear priorities, affected systems, and defined remediation pathways.
The Top 25 Exploitable Exposures dashboard embodies the principle that effective vulnerability management requires the ability to see everything, predict what matters, and act with confidence across the full scope of the organization's attack surface. By surfacing the most prevalent and most dangerous exploitable vulnerabilities alongside the assets carrying the greatest concentration of risk, the dashboard transforms raw telemetry into a structured risk narrative that bridges the gap between Security Engineers executing remediation and Security Managers communicating program progress to organizational leadership. The inclusion of unsupported product data extends visibility beyond patchable vulnerabilities to the permanent exploitable exposure introduced by end-of-life technology, ensuring that lifecycle management decisions are grounded in actual security risk data rather than administrative schedules alone. Security Managers gain the executive-ready context needed to justify remediation investments and report meaningful progress, while Security Engineers gain the operational clarity required to sequence remediation work with precision and prioritize effort where threat likelihood is highest. The dashboard enables the organization to unify security intelligence and remediation action into a coherent program that moves from reactive exposure response toward proactive risk reduction at a pace determined by actual threat data rather than arbitrary timelines.
Widgets
• Remediation by Patch Availability (Explore) - This widget summarizes vulnerability remediation capacity segmented by patch availability, exploit status, and malware exposure, helping Security Engineers prioritize patch deployment cycles based on actual weaponization risk rather than severity scores alone.
• Solutions Summary (Explore) - This widget organizes active vulnerabilities by their recommended remediation solution, transforming raw finding counts into actionable work items that can be directly mapped to patch or change management workflows.
• Top 25 Most Prevalent Exploitable Exposures - Sorted by Count (Explore) - This widget identifies the twenty-five most widespread exploitable vulnerabilities ranked by affected asset count, revealing systemic weaknesses that may indicate missing patches or configuration gaps affecting large portions of the infrastructure.
• Top 25 Worst Exploitable Exposures - Sorted by Tenable VPR (Explore) - This widget ranks the twenty-five most dangerous exploitable vulnerabilities by Tenable VPR, surfacing the exposures most likely to be weaponized by threat actors based on actual exploit likelihood rather than CVSS severity alone.
• Top 25 Assets with the Most Exploitable Exposures - Sorted by Exploit Count (Explore) - This widget identifies the twenty-five assets carrying the highest concentration of exploitable vulnerabilities, pinpointing where remediation efforts will have the most impact on reducing the organization's overall attack surface.
• Top 25 Unsupported Product Findings (Explore) - This widget surfaces the twenty-five most prevalent unsupported or end-of-life product findings, exposing software that no longer receives security patches and represents permanent exploitable risk requiring upgrade or replacement strategies.
• Top 25 Assets with the Most Unsupported Product (Explore) - This widget identifies the twenty-five assets running the highest number of unsupported or end-of-life products, highlighting systems that may require complete technology refresh rather than incremental patching.
• Top 25 Worst Unpatchable Exploitable Exposures (Requires Config Change) (Explore) - This widget highlights the twenty-five most severe exploitable vulnerabilities that cannot be resolved through patching and require configuration changes or architectural remediation, distinguishing this risk category from standard patch management workflows.
Tenable One
Request a demo
The world’s leading AI-powered exposure management platform.
Thank You
Thank you for your interest in Tenable One.
A representative will be in touch soon.
Form ID: 7469
Form Name: one-eval
Form Class: c-form form-panel__global-form c-form--mkto js-mkto-no-css js-form-hanging-label c-form--hide-comments
Form Wrapper ID: one-eval-form-wrapper
Confirmation Class: one-eval-confirmform-modal
Simulate Success